Bitboy on Nostr: 📊 2017 This is a graph of Bitcoin from 2017. Look what it did: started the year ...
📊 2017
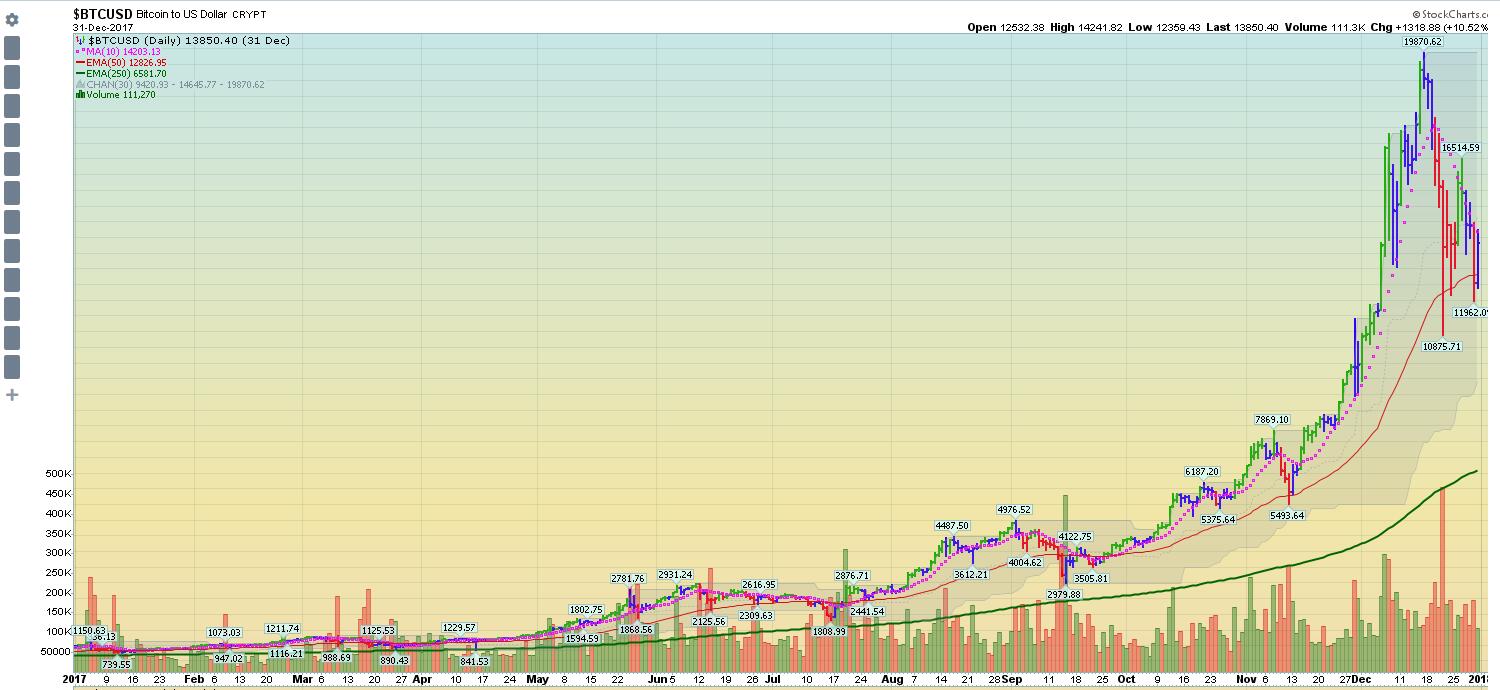
This is a graph of Bitcoin from 2017. Look what it did: started the year around $1,000 and went vertical to nearly $20,000 by December — up roughly 1,800%. The first mainstream mania, complete with the parabolic spike and the beginning of the crash in the last weeks. The chart that made Bitcoin a household word.
Published at
2026-10-10 11:26:52 UTCEvent JSON
{
"id": "783f617f5f1dadc930ba1a05c8eb9691bbfac12725e598752e44e0a86d418f7b",
"pubkey": "f6f88150a4e12751e280aad35423a53ae304132ef1cc5617a9cb2d86bb9ac630",
"created_at": 1791631612,
"kind": 1,
"tags": [
[
"t",
"bitcoin"
],
[
"t",
"charts"
],
[
"t",
"stockcharts"
],
[
"imeta",
"url",
"https://image.nostr.build/f9a63c7d223fc04d3c4628be7c317d63c39a350a8d6382f57babe13a00c18eb1.jpg",
"m",
"image/jpeg"
]
],
"content": "📊 2017\n\nThis is a graph of Bitcoin from 2017. Look what it did: started the year around $1,000 and went vertical to nearly $20,000 by December — up roughly 1,800%. The first mainstream mania, complete with the parabolic spike and the beginning of the crash in the last weeks. The chart that made Bitcoin a household word.\n\nhttps://image.nostr.build/f9a63c7d223fc04d3c4628be7c317d63c39a350a8d6382f57babe13a00c18eb1.jpg",
"sig": "75ef50cd0701eac70ea1478ad75b6b67dd7239bc3f10d9a61f4ed5e3ac233f8a2bf178f08fa8972d190c262e643f92cb935049f1203973972806b6678effc553"
}